AFL Player Importance and Impact
A look at AFL players in the context of their own teams

This article uses data visualisations to examine player impact and importance within their own teams as a way of understanding team construction, with some takeaways for AFL fantasy.
Data
The publicly available statistics were scraped from the individual pages for each match from Footywire for the 2019 season. The raw dataset comprises player statistics and are matched back to individual player positions. Our full dataset comprises 656 players for the regular 2019 season.
Player Importance
Suppose we consider player importance within their own teams according to the amount of time that they spend on the field, both on a per-game basis as well as in aggregate for the season. This allows us to “read” the coach’s mind through their active choices during game time. For this exercise define three categories for each player (1) Match Status (2) Core Status and (3) Season Status.
Match Status In the absence of easily available data on team line-ups, we create our own player-match status according to their time on ground (TG) ranking relative to other players within their own teams. “Field” players are those ranking in the top 18, “Bench” players are the next 4 and “Dropped” indicates they did not play the game.
There are a number of reasons that players may not be selected for the following match — injury, suspension, resting, poor performance or just normal player rotations.

On average 3 to 4 players will be rotated off the field for each match during the season — either to the bench or dropped. Teams show some variation — the highest variation between teams are Collingwood vs Essendon and Melbourne; we will use these teams to understand how coaches think in terms of team composition.
Core Status The following chart compares the player-match status for pairs of consecutive games across the 2019 season, with each vertical line representing a single player.
The chart suggests that coaches are making dynamic decisions about how players are performing during the course of the game and assigning them more or less time on ground as the match evolves.

We use this to define player importance for a given match according to their time on ground (1) Core — players with above 85% time on ground (2) Non core — players with less than 75% time on ground (3) Developing — players between 75% and 85% time on ground.
Season Status is defined according to the number of matches played during the season. From the data, we observe that the top quartile will play at least 18 games during the season, while the top half will play at least 10 games during the season.
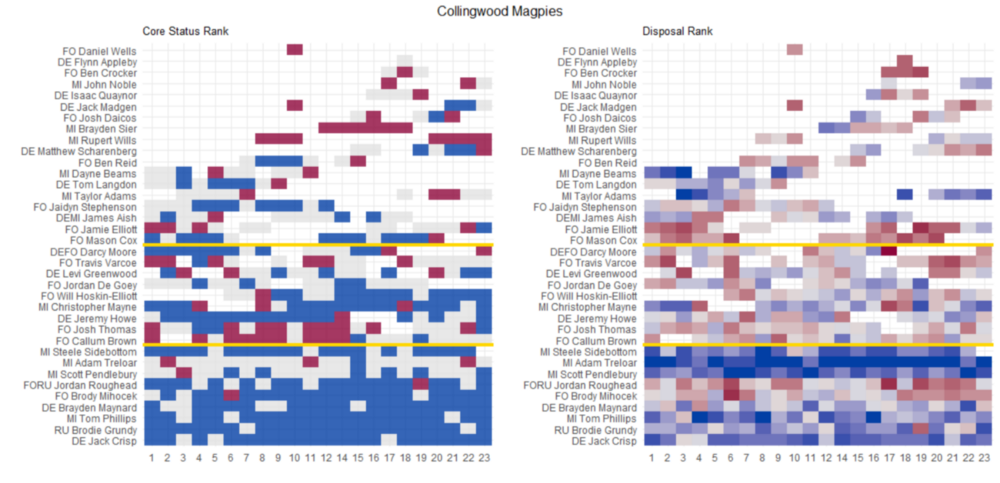
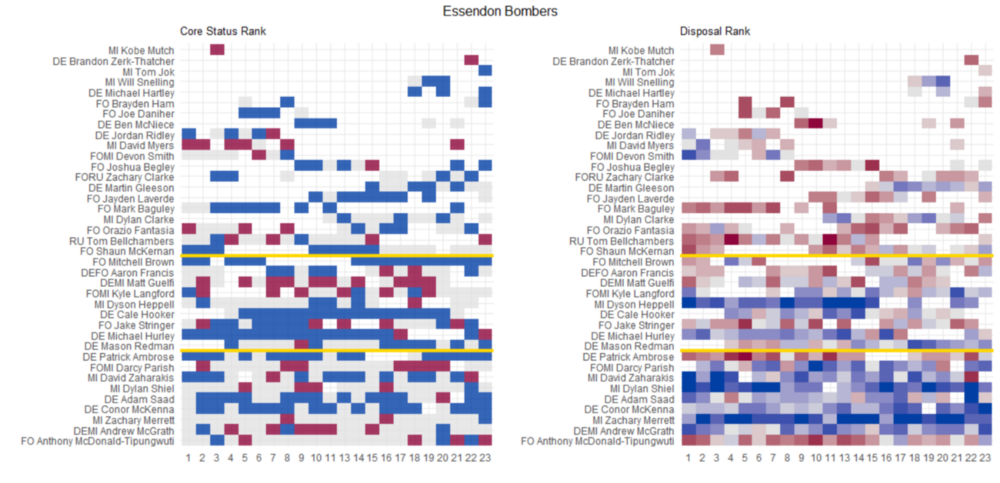
By classifying player importance according to time on ground for each match as well as for the season we can now compare the team structure of Essendon vs Collingwood and identify players of interest.
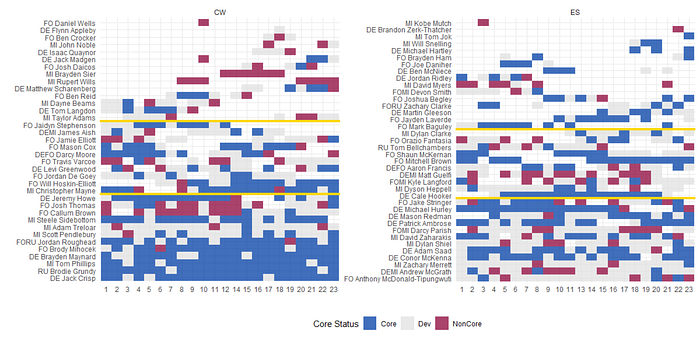
- Core players in Collingwood have more time on ground than Essendon as can be seen by a darker blue base. All else equal, this implies that Essendon players will have lower fantasy scores.
- Team Structure Essendon’s core team comprises more defenders; Collingwood’s core team comprises mids and forwards. It would be interesting to investigate further whether this was by design; Essendon began the season at 18th position and ended 7th while Collingwood began at 11th and ended 5th.
- Streaks of matches not played, particularly for core players makes it easier to identify if it was due to non-performance, rotations or otherwise.
- Rookies We can see the average number of opportunities afforded to play during a given season as well as highlighting the likely next generation of developing players. Collingwood rookies on average have less time on ground than Essendon rookies.
- Season Games The gold lines delineate the number of games played during the season; the top one which is a marker for at least 10 games —is useful to know when considering whether a player will be at “discounted” pricing for the following season in AFL Fantasy.
When I discussed the idea of nirvana charts previously which combines player-team information succinctly, this “tile format” comes pretty close to it.
Player Impact
To take our analysis a bit further, we now consider the value or impact that a player has within their own teams. In a previous article, we looked at the statistics that matter in terms of fantasy points.
We look at two key statistics — disposals and possession — to understand the strengths that each player position brings to the team. For each of these statistics we will rank a player on how they perform relative to their own team within a given round by a given coloured tile. This allows us to more easily consider player impact and skill even within low scoring matches.
Ranking by Disposals This accounts for the bulk of scoring points for AFL fantasy; as highlighed in the previous article, it is characteristic of midfielders.
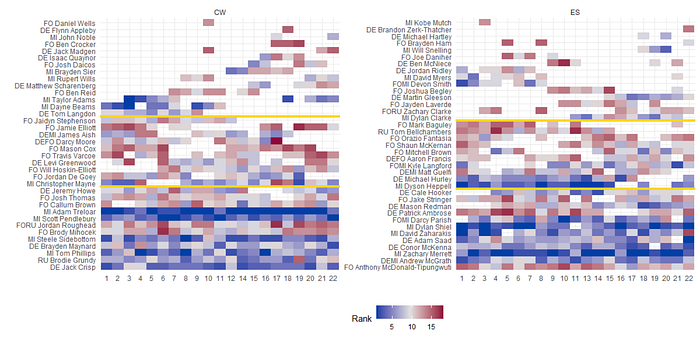
- Elite Players within each team (blue streaks) are usually midfielders — Scott Pendlebury, Adam Treloar, Tom Phillips, Steele Sidebottom, Zac Merrett, Dylan Shiel and David Zaharakis. Defender Jack Crisp also features in this group.
- Rising talent Both Dyson Heppell and Michael Hurley from Essendon had a good start to the season although didn’t play as many matches in the second half.
- Rookies who progress during the season — some talent in Dayne Beams from Collingwood and Devon Smith and Martin Gleeson from Essendon.
- Forwards tend not to perform as well in this measure — Anthony McDonald-Tipungwuti, Jordan Roughead and Brody Mihocek are core players to their teams but rank lower than average in this measure.
- Team Strength On the margin, Collingwood appears to have stronger top tier players (> 16 matches for the season) and weaker 2nd tier players (between 10 and 16 matches for the season) relative to Essendon, when we look at the distribution of tile colours across each group.
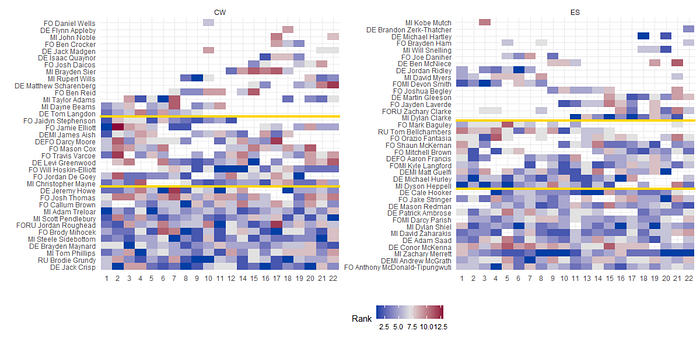
Ranking by Possessions This metric is the sum of marks and tackles. Note that there is less distinction between player tiers between teams on this metric, although the bias is skewed towards Collingwood being stronger.
Directions for Future Research
This has been a fruitful exercise into visualisation of player importance and impact within their own teams as well as providing some takeaways from an AFL fantasy perspective.
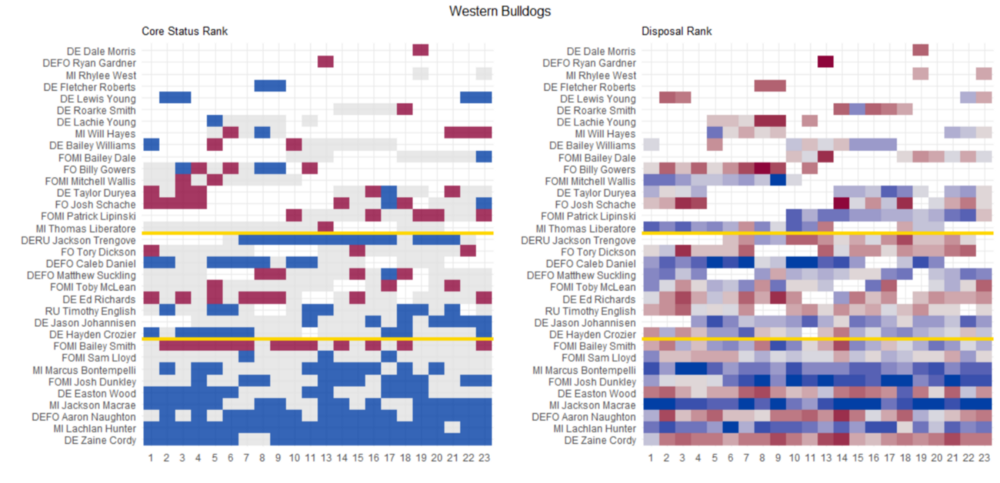
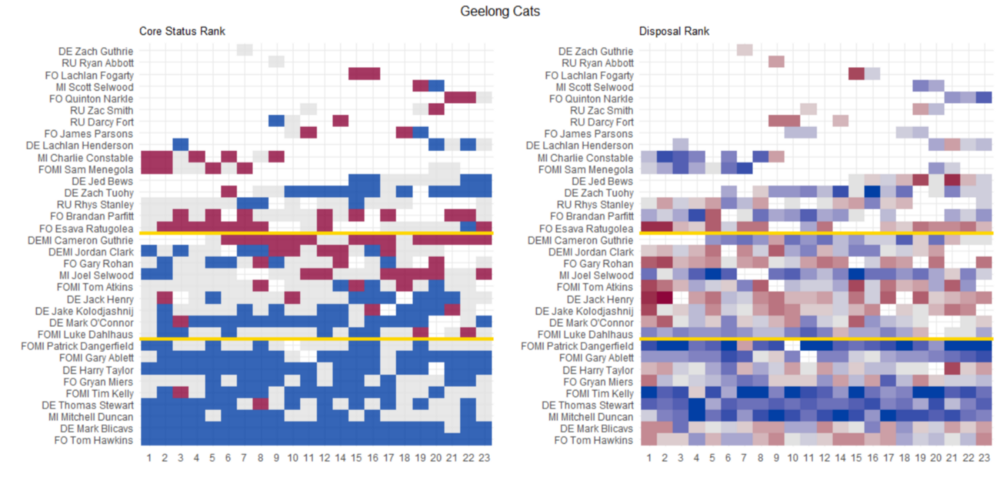
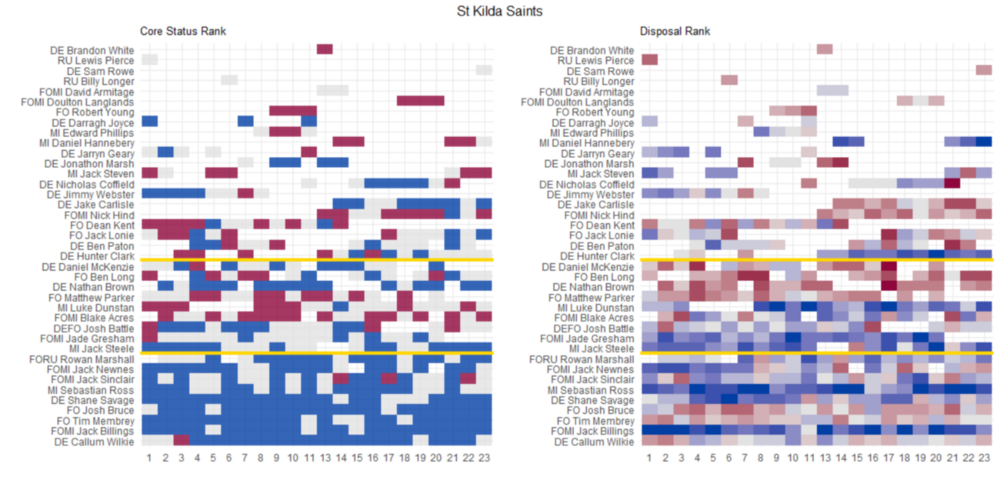
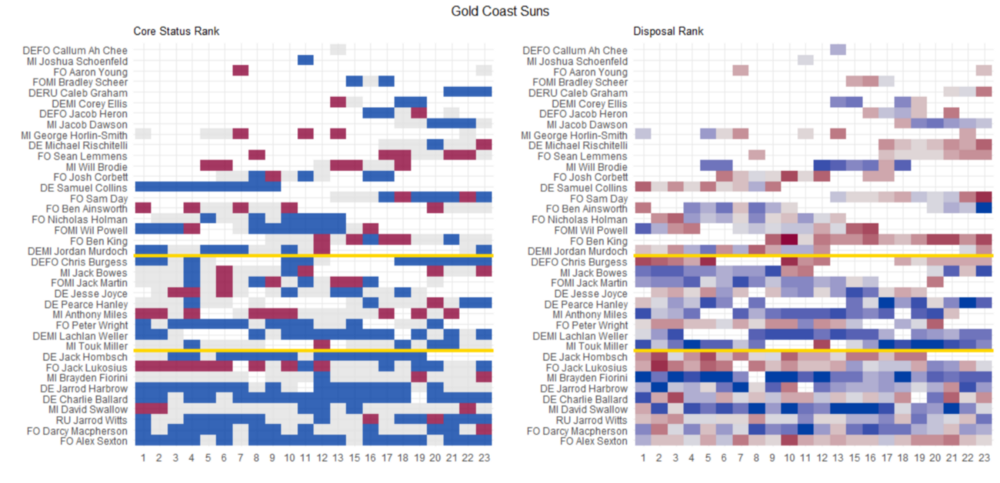
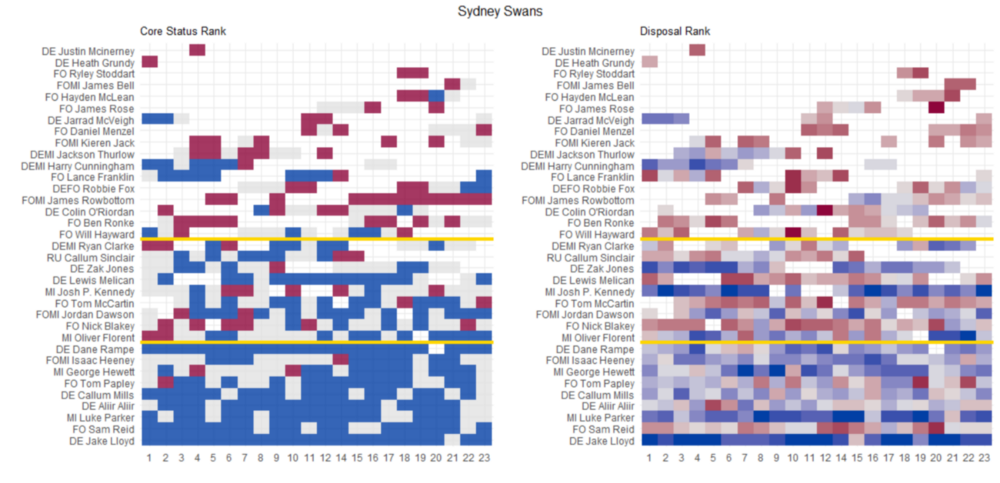
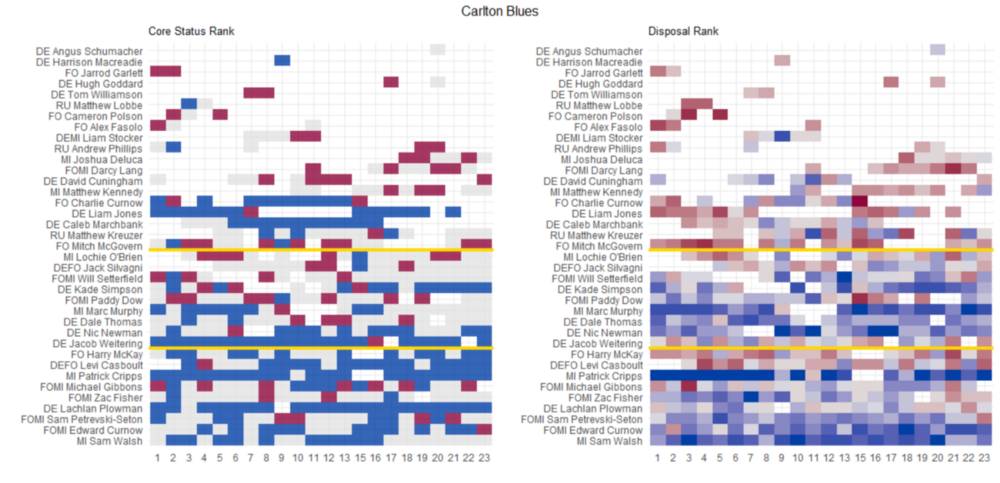
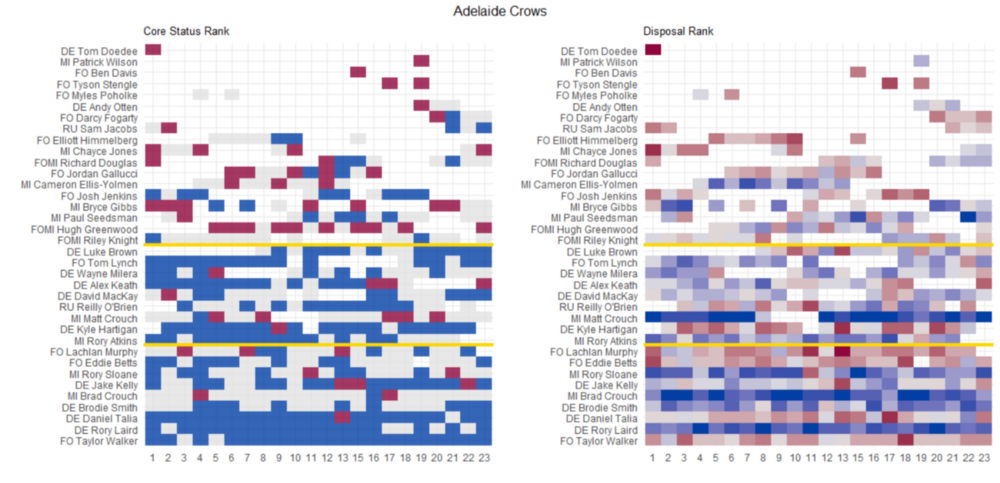
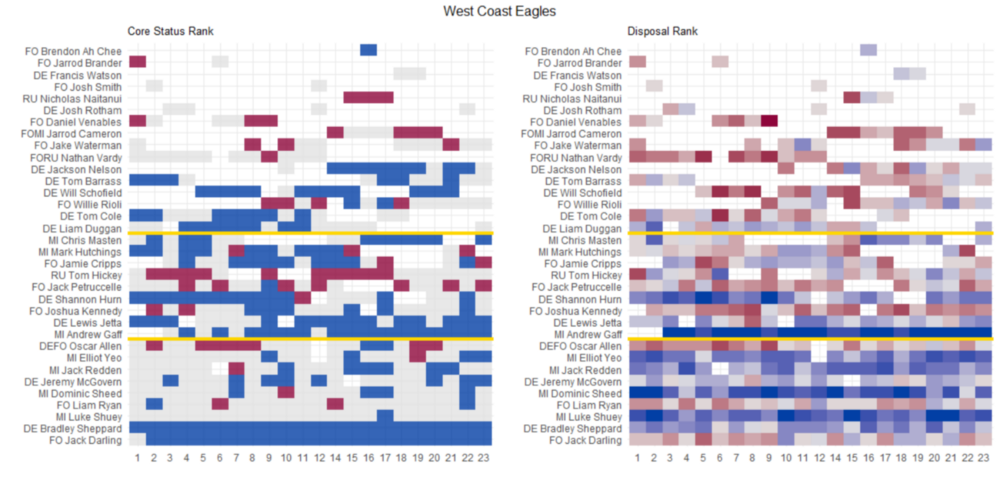
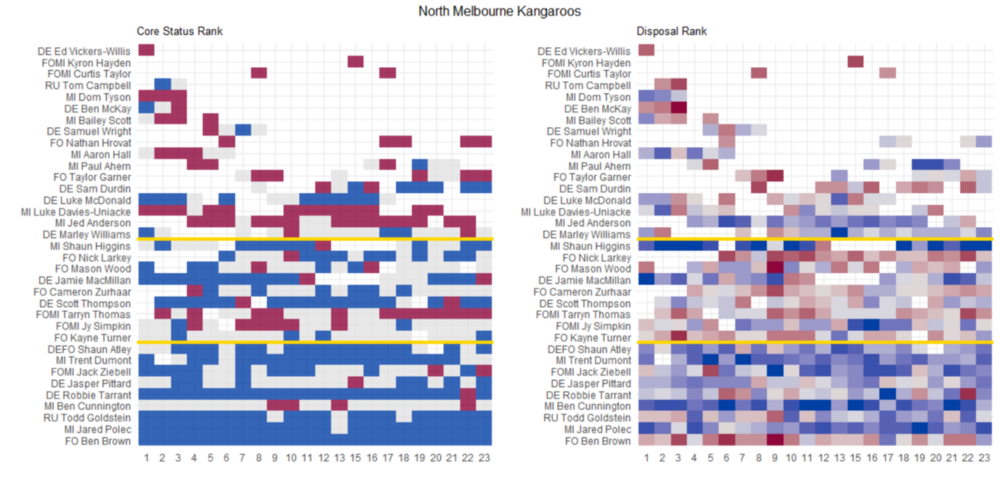
The appendix that follows presents the pairs of charts for each of the teams in 2019.
If you have found this analysis useful, please give me a clap or two to indicate your support for development of a free dynamic web application which enables a comparison for all teams and players across the full suite of available AFL statistics.
Appendix : Player Importance and Impact by Team
The teams are organised according to their ladder position at the end of Round 1 for the 2019 Season. (Click on any image below to zoom in)